Full disclosure this is only a semi-serious Guide on "How to become a watch analyst." But I think it is a New Year and this also means new chances to take more people onto this - in my opinion - extremely fascinating and necessary journey, which I refer to as ... #watchanalytics ... In the following I'd like to share a bit about my process, how my data is set up, and how I find the topics that might be interesting. It will be a bit of a behind-the-scenes of how all my published articles have come about and what the potential of this particular style of watch journalism might be.
February 08, 2021
How To Become A Watch Analyst
 Marcus Siems @siemswatches
Collector, Author, Data Analyst
Full disclosure this is only a semi-serious Guide on "How to become a watch analyst." But I think it is a New Year and this also means new chances to take more people onto this - in my opinion - extremely fascinating and necessary journey, which I refer to as ... #watchanalytics
In the following I'd like to share a bit about my process, how my data is set up, and how I find the topics that might be interesting. It will be a bit of a behind-the-scenes of how all my published articles have come about and what the potential of this particular style of watch journalism might be. And if in the end one of you might get the inspiration or aspiration to follow me along that's a tremendous bonus.
 In the end, all the analyses can only exist when they enlighten us on the background of all these beautiful vintage pieces out there. Every data-point is a story of its own. Photo @goldammer.me
1) The Analyst
First, I like to explicitly separate between watch experts and analysts. In an analogy there is a similar distinction in American sports broadcasting, in American Football for example.
On the one hand there are the experts; Former NFL players that have been in locker-rooms and title contention and know the ins and outs of how it feels for the players out there. Additionally, they can very well disect the ongoing play-calling and the momentum in a game from their own perspective and experience.
The analyst on the other hand doesn't inevitably need to be close to any stadium at all. What you need is a large pile of data to predict the likely outcome or to describe the game of a team or a player based on data of previous observations. It's about probabilities and not experiences.
 Extracting the commonalities of vintage watches and combining the information of several pieces is what enables the #watchanalytics approach of storytelling. Photo @goldammer.me
That is the distinction between qualitative and quantitative research/journalism. In the watch world the qualitative aspect are featured in stories about the history of a piece worn by monarchs escaping their own countries[1], busting Frankenwatches at auctions[2] or gathering opinions about how social media affected the watch world[3].
All these types of articles have in common that they are well researched but they have a very detailed focus on a small portion of the watch world. Whereas quantitative journalism can combine numerous sources of data to give a much broader overview.
Most importantly quantitative and qualitative information complement each other very well. I will give a few examples later. However, so far the qualitative dimension is the backbone of almost all watch outlets whereas the quantitative dimension is mostly missing. That is the reason why I became involved with this endeavor, it's a niche that's been neglected.
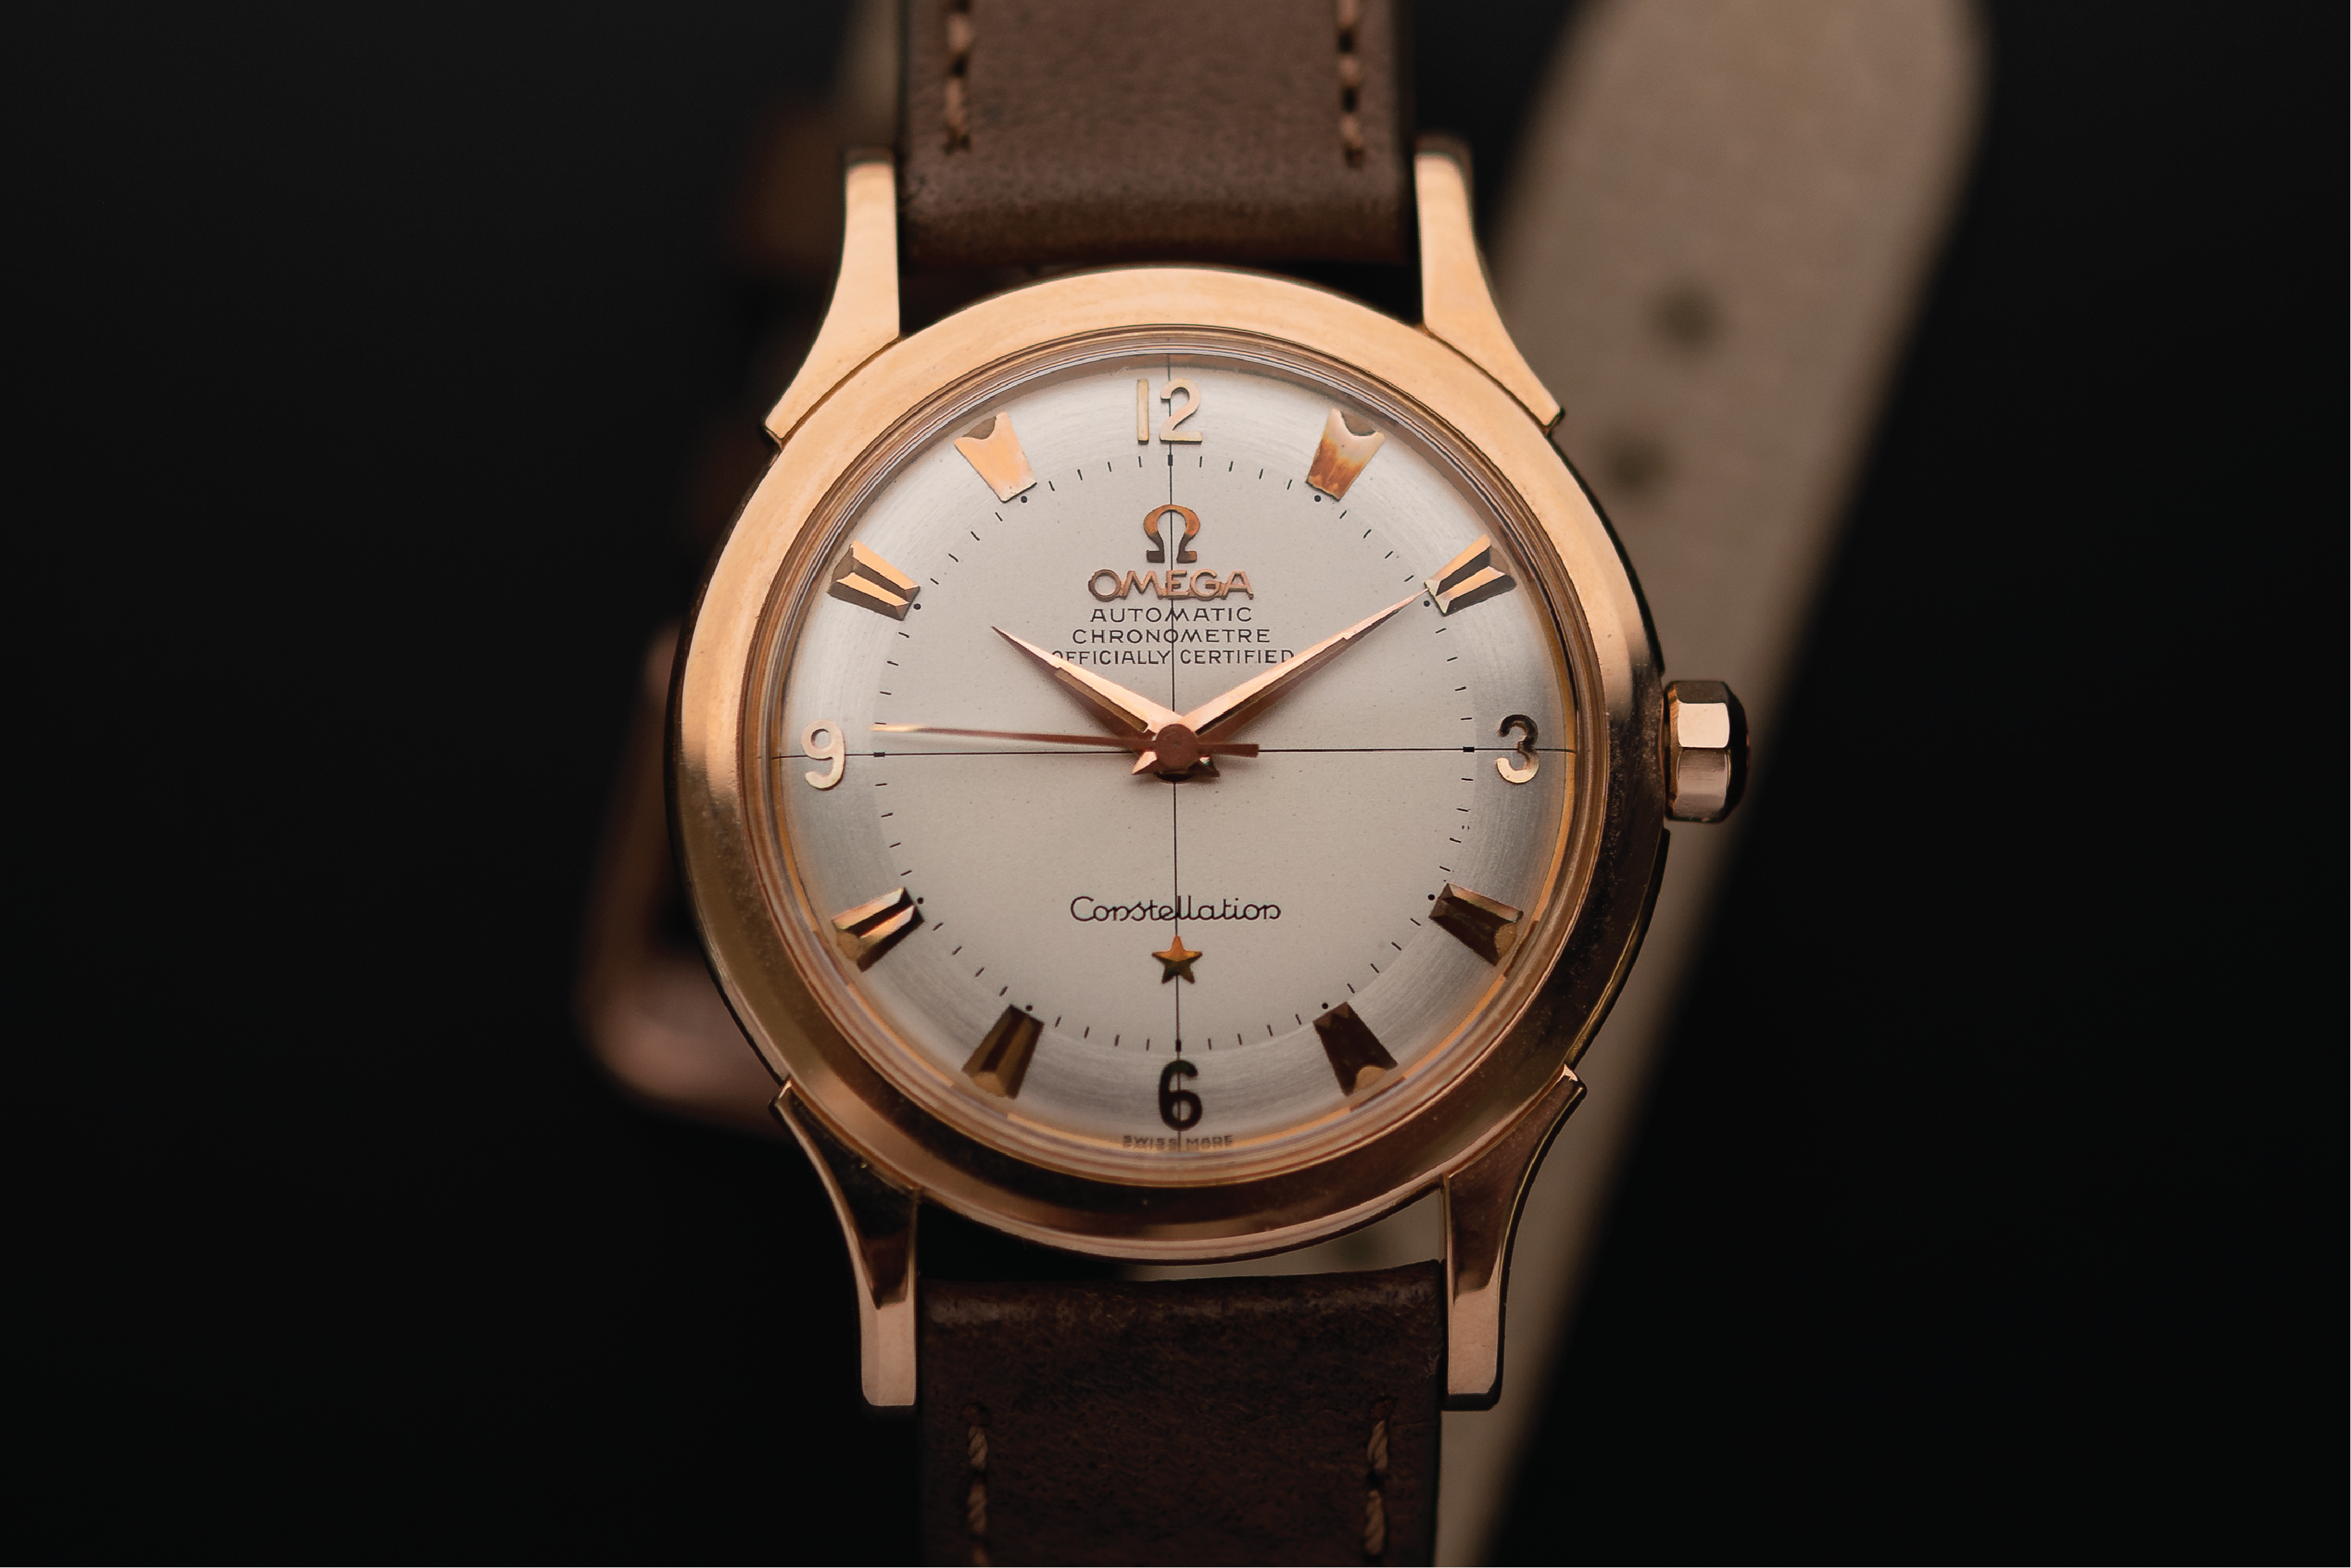
 This is a stunning rose golden Omega Constellation ... But what story do you wanna tell? A story about the reference, the looks, the style? Or a story about the time this piece was born into, and how the design has been an interaction with the Zeitgeist?. Photo @goldammer.me
1) The Data
If you'd like to start your watch analytics blog you first need to get your hands on some data. And the interesting bit about this first part is that the data already defines the type of questions you can answer. One thing to keep in mind is that as long as you don't have all information possibly out there you will always have a certain "sampling bias".
Do you take your data from a source that focuses on a single brand? Or on high-end watches? The European market? The auction world? Even a combination of sources will still leave you with a bit of uncertainty what exactly you can depict. Most market research out there is focusing on factoring in what type of sample they have been using, and a reason why for example the pollster were so off during the 2016 US Presidential Election[4].
 In data analysis choosing a reliable data-source is as pivotal as it is to find a reliable dealer if you want to buy a watch. Photo @goldammer.me
I personally chose my dataset from Chrono24[5]. For me this is a large database, not too much dedicated to a particularly brand and it has the market angle with it. The number of watches is indicative of how many might be still around - as opposed to a catalogue-type of database where every watch gets the same weight in the analysis irrespective of how often it was produced, sold or preserved. As I want to give an overview and an introduction into the world of vintage watches this is the most straight forward information I could think of.
 The base for every of my own analyses - a simple excel sheet.
In the end, I scrape the information I need off the website. The drawback is that many design features are not covered in that database. I've for example written articles about the case-shape, hour markers, hand styles, none of which are directly accessible via the website. So I have to classify several features in hours and hours of manual work.
2) The Analysis
After the data collection comes the fun part of doing the actual analysis. All the stories and trends are in that one excel sheet but who can make real sense of it? What you want to achieve with any quantitative analysis is to make the information hidden in the countless numbers and letters in your data comprehensive.
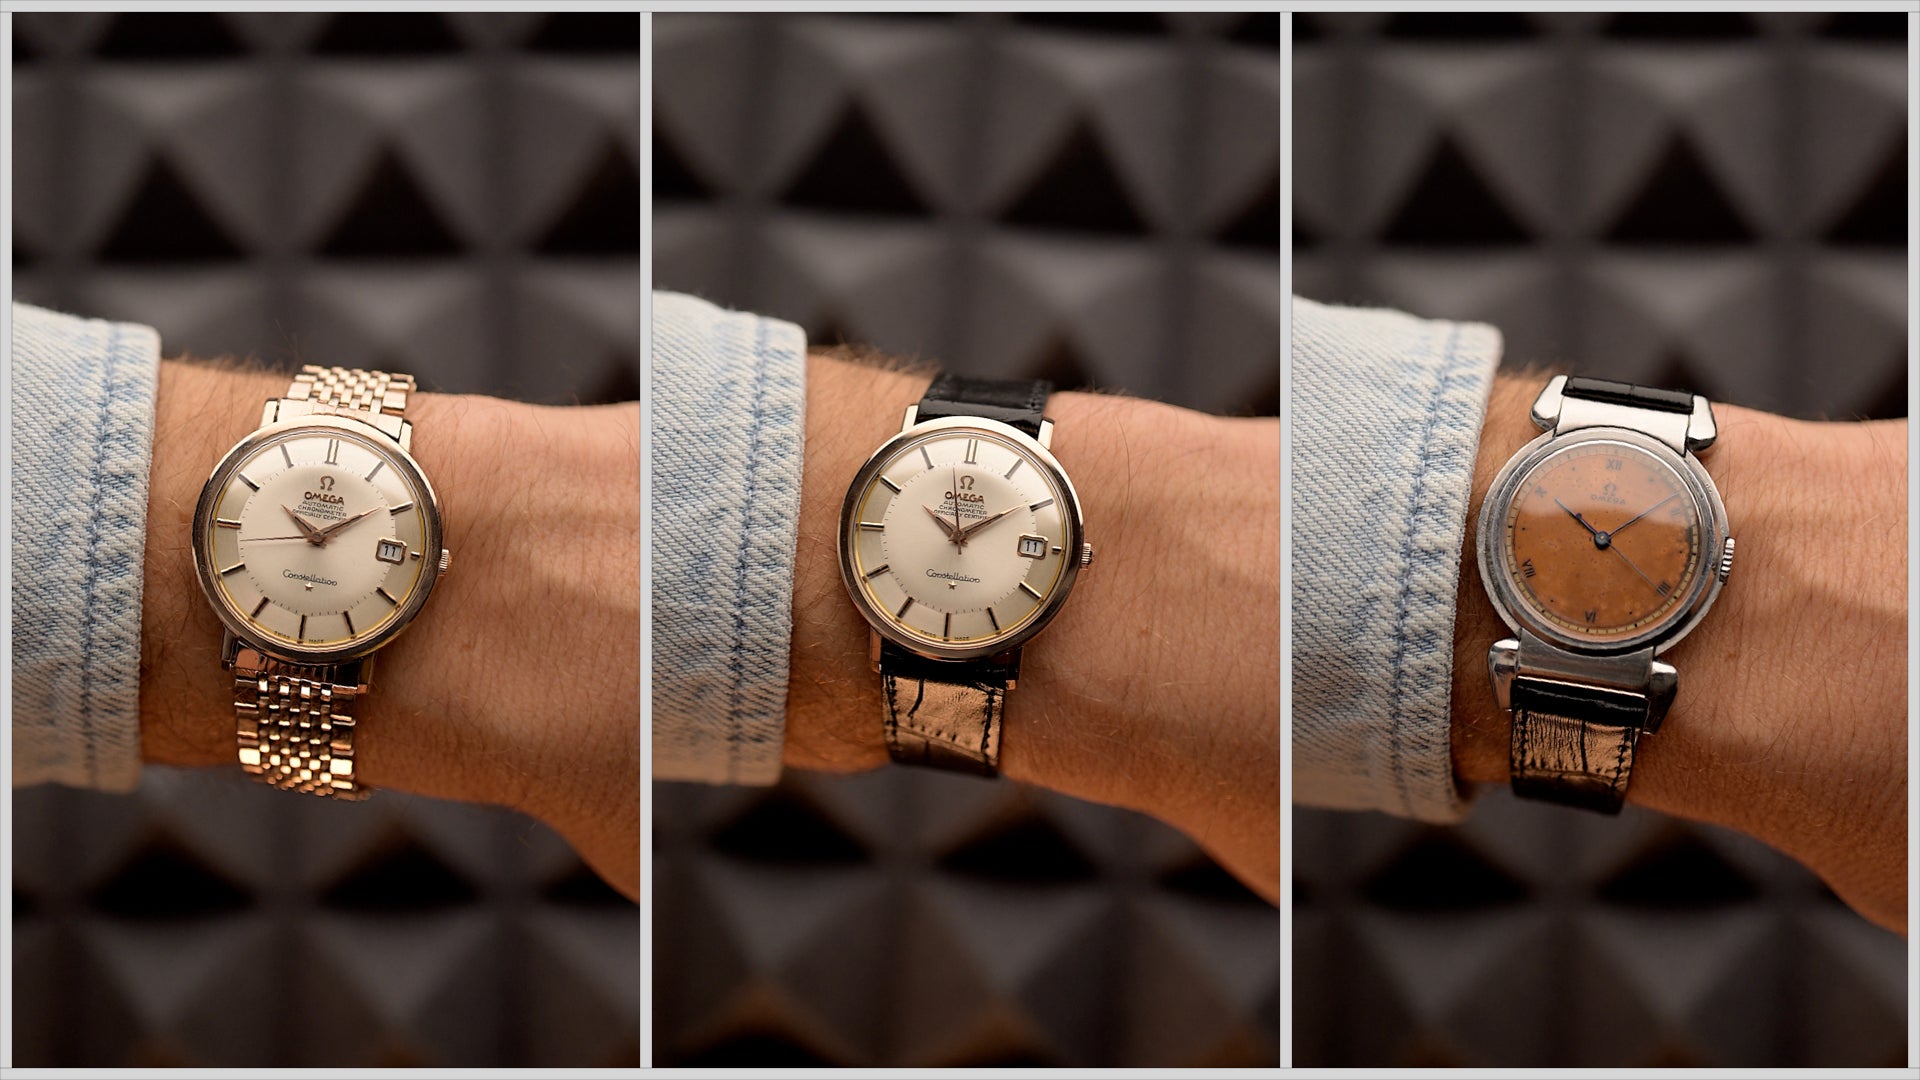
 A little throwback to my very first story... How does a watch like this - a stunning, patinated 1950s Jaeger-LeCoultre Memovox - relate to the time it was conceived and manufactured? Photo @goldammer.me
The starting point for your analysis is the story you want to tell. The idea I had when starting this project was to tell a story about time and not just timepieces so my first analysis was about watches of the 1950s. Seeing what type of hands, markers, watch styles have been used. So maybe let's do a similar toy analysis here for the 1960s.
 Figure 1. Quantitative data of the 1960s vintage watch world... Those are the facts but what story do you make out of it?
However, from a total of 20 features that I gathered you still need to cut down a bit. After all, you want to tell a story and not just amass plots. So you gotta pick which analyses foster a thorough exploration of the topic and which are just clutter. But more on this a little later.
Lastly, if you want to do an analysis you need some sort of software to carry it out. Of course you could do everything with Excel and related products but I personally prefer coding-based stats software. With a bit of practice it gives you a lot more freedom to explore your data and customize everything to your own needs. I usually use MatLab[6] but licenses aren't cheap. There are other open-source possibilities with great supportive communities like R[7] & Python[8].
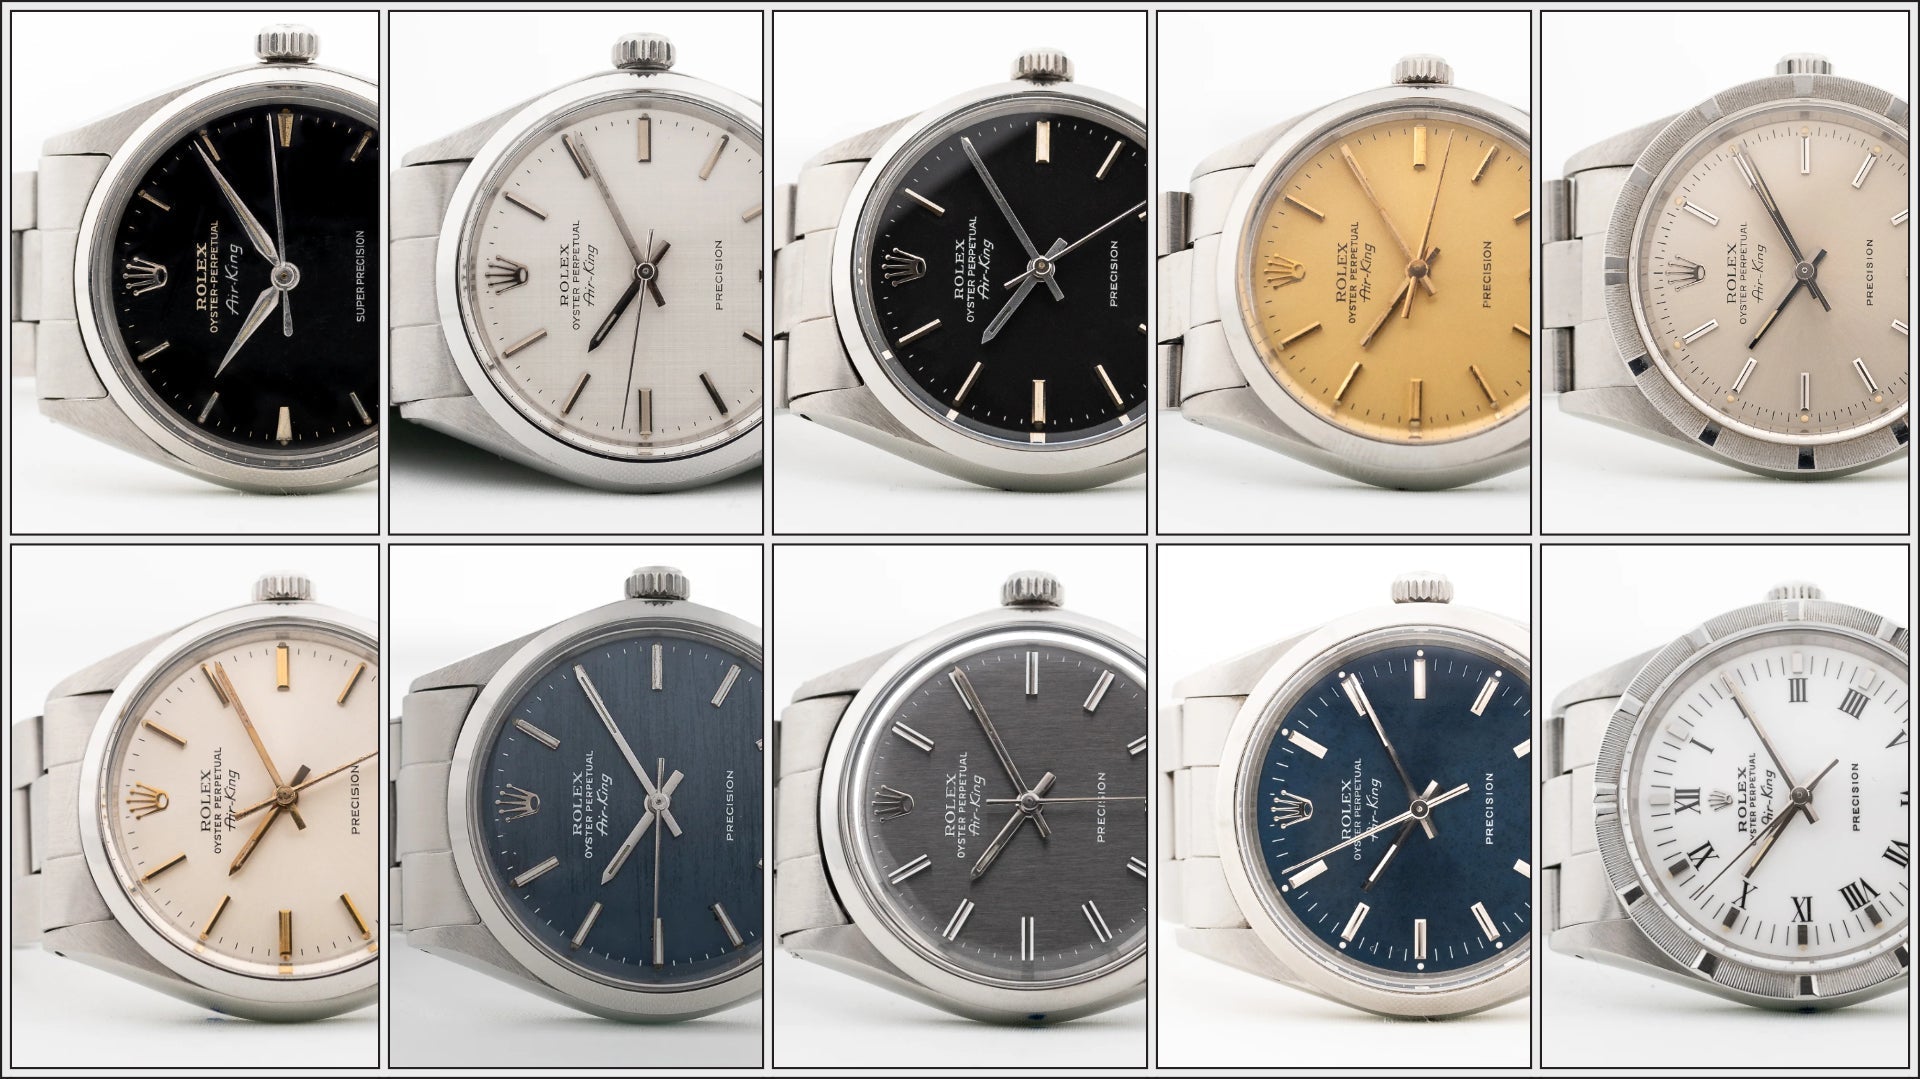
 How much data do you want on a dial or in a watch article? ... Yes!
3) The Storytelling
First you get your data, then you do the appropriate analysis and then finally you can put everything together into one story that you want to share with the world. I really like this order, I like to to explore the data and let the story find me rather than having a too fixed hypothesis to follow. I don't want to have a too narrow vision.
Data visualization needs to aid understanding. In my opinion making a context visible is the raison d'être of quantitative analyses. So let your plots guide you through the story, they are the cornerstone of your text.
Nevertheless, the story needs to include additional information beyond the data. You don't want to simply point to graphs and act like that's the world. The "why" for example a certain watch type has been popular cannot be told from the numbers. You need again the aid of qualitative research to add a little background to your findings. That is the valuable interplay between those two.
 If you're not sure what time period to write about, why not just doing a bit about a timeless Patek Philippe time-only dress watch? Photo @goldammer.me
4) References
The last but never forgotten part of your creative journey - references. No one is telling stories out of thin air. First, be a good sport and give credit where credit is due. Intellectual property is a real thing. Second, other people might be interested and want to have a closer look into that one part of the story. Finally, everyone gets inspiration from somewhere and at times you start to live and research in a bubble. References make people understand better why you have a particular opinion and add depth to your storytelling.
 In the sentiment of naming all the references you have for an article ... I'd like to point everyone to the beautiful inspiration and the so very necessary visual aid for these articles over @goldammer.me
I hope you enjoyed this tiny bit of insight on how such an article is created - from conception to execution - was as enjoyable to read as it was for me to share my process. I'll do more articles of this kind in the future to elaborate and to advocate the methods that might be helpful for other watch analysts out there and just everyone trying to understand what I'm even doing.
References
[1] Remembering A Fallen Kingdom With A Royal Rolex; Cole Pennington, Hodinkee;
https://www.hodinkee.com/articles/a-royal-laotian-legacy-lives-on-in-a-rolex-gmt-master-1675-2
[2] Planet Of The Fakes: A Rinaldi "Big Crown" 5510 At Antiquorum Hong Kong; Jose Pereztroika, Perezcope;
[3] Has Social Media Been A Source For Good In The Watch World?; A Collected Man;
https://www.acollectedman.com/blogs/journal/social-media-watch-world
[4] An examination of the 2016 electorate, based on validated voters; Pew Research Center;
[5] Watches from Chrono24, extracted 2020 Nov. 29th; Karlsruhe, Germany;
[6] MatLab 2020a; Mathworks, Natick, Massachusetts, USA;
https://www.mathworks.com/products/matlab.html
[7] The R Project for Statistical Computing; The R Foundation;
[8] Python; Python Software Foundation;
All rights on text and graphics reserved to the Author.


Leave a comment